ようへいの日々精進XP

よかろうもん

Grafana v2.6 の Raw Document についてちょっと調べた雑なメモ

ちょっと調べて雑にメモりました。

tl;dr

docs.grafana.org

Raw Document について聞かれたけど、全然知らなくて申し訳ないなと思ったのでちょっと調べてみた。


メモ

Raw Document とは

If you want to show documents from Elasticsearch pick Raw Document as the first metric.

ドキュメントの冒頭には上記のように書かれている。ざっくり意訳すると...

  • Elasticsearch をデータソースとして利用している場合に
  • ドキュメント数を取得することが出来そう

This in combination with the JSON Data table transform will allow you to pick which fields in the document you want to show in the table.

さらに上記を読み解くと...

  • どうやら Table パネルで利用出来そう
  • Elasticsearch のドキュメントから任意の JSON キーを指定してその値を時系列で出力できる

うんちくではイマイチわからないので...

以下のような環境を作って試してみた。

f:id:inokara:20160305093358p:plain

Grafana のデータソースとして Elasticsearch を指定する

f:id:inokara:20160305090034p:plain

  • Type には Elasticsearch
  • URL には Elasticsearch の Endpoint URL
  • Access タイプは Elasticsearch の Endpoint URL を直接指定するので Proxy を選択
  • Index 名は Kibana で指定する場合と同様に [] 名前を指定して YYYY.MM.DD でタイムスタンプを指定する
  • 時系列フィールドとして @timestamp フィールドを指定する

Table パネルで Raw Document を指定する

  • まずは Add Panel で Table Panel を選択する

f:id:inokara:20160305091010p:plain

  • Metrics タブの Metric で Raw Document を選択する

f:id:inokara:20160305091020p:plain

  • Options タブの To Table Transform で JSON Data を選択する

f:id:inokara:20160305091030p:plain

JSON Data を選択する Elasticsearch のドキュメントフィールドが指定可能になるので、試しに @timestampsizecode を指定すると以下のように。

f:id:inokara:20160305091611p:plain


まだまだ疑問が残るけど

Raw Document とは

  • Elasticsearch をバックエンドとする際にドキュメント数を可視化することが出来ると思われる
  • 例えば、Elasticsearch にログを突っ込んでいる場合にはログの件数とか
  • 同様に table パネルを利用すると Kibana の Table panel のような使い方が出来ると思われる

気になったところ

  • Raw Document で JSON Data 指定する場合には Thresholds でカラムや文字に色を付けられない→仕様なのかな?
  • Grafana が解析出来ないクエリを設定してしまうと下図のような Warning となってしまい Query フィールドを閉じることが出来ない(× で閉じない)→この環境だけなのかな?

f:id:inokara:20160305092852p:plain

以上、メモでした。

Sensu 復習(2)〜 OpenWeatherMap と Sensu + Grafana で熱中症対策 〜

はじめに

ムシムシとした日が福岡では続いていますがいかがお過ごしでしょうか。

既に奥さんが熱中症っぽい症状で寝込んでしまっているのを見て、旦那として看病以外で役に立てないものか思いを巡らせて辿り着いたのが、気温、湿度を収集して可視化、不快指数を計算して事前に警告する等が手元の環境で出来そうなので試してみたメモ。


OpenWeatherMap で温度と湿度を取得する

OpenWeatherMap とは

openweathermap.org

ざっくり、無料で天気の情報を API 提供してくれる有り難いサイトで、例えば、福岡の天気は以下のようなリクエストを投げる。

$ curl -s 'http://api.openweathermap.org/data/2.5/weather?q=fukuoka-shi,jp&units=metric' | python -m json.tool

以下のようなレスポンスが返ってくる。

{
    "base": "stations",
    "clouds": {
        "all": 75
    },
    "cod": 200,
    "coord": {
        "lat": 33.609999999999999,
        "lon": 130.41999999999999
    },
    "dt": 1436654395,
    "id": 1863967,
    "main": {
        "humidity": 83,
        "pressure": 1004,
        "temp": 26.760000000000002,
        "temp_max": 28.329999999999998,
        "temp_min": 24.440000000000001
    },
    "name": "Fukuoka-shi",
    "sys": {
        "country": "JP",
        "id": 7546,
        "message": 0.0149,
        "sunrise": 1436559409,
        "sunset": 1436610639,
        "type": 1
    },
    "visibility": 10000,
    "weather": [
        {
            "description": "broken clouds",
            "icon": "04n",
            "id": 803,
            "main": "Clouds"
        }
    ],
    "wind": {
        "deg": 110,
        "speed": 1.5
    }
}

レスポンスの詳細については以下のドキュメントを。

openweathermap.org

ざくっと、今回利用したいキーは以下のとおり。

JSON キー 内容 備考
['main']['humidity'] 湿度
['main']['temp'] 温度 リクエストパラメータで units=metric を付けると摂氏となる

不快指数とは

keisan.casio.jp

気温と湿度から算出する夏の蒸し暑さを数量的に表した指数で計算式は下記の通り。

0.81 × 気温 + 0.01 × 湿度 × (0.99 × 気温 - 14.3) + 46.3

例えば、先ほどの API レスポンスから算出すると以下のとおりとなる。

0.81 × 26.760000000000002 + 0.01 × 83 × (0.99 × 26.760000000000002 - 14.3) + 46.3 = 76.8552

算出された不快指数から体感を以下のように分類されている。(Wikipedia より引用)

不快指数 体感
~55 寒い
55~60 肌寒い
60~65 何も感じない
65~70 快い
70~75 暑くない
75~80 やや暑い
80~85 暑くて汗が出る
85~ 暑くてたまらない

ということで、温度、湿度の値を収集しつつ、不快指数を算出してアラートを上げる仕組みを作ってみることにしよう。


Sensu と Grafana の用意

構成

f:id:inokara:20150711150616p:plain

しきい値

しきい値は以下のように定義。

不快指数 体感 Sensu のしきい値
~55 寒い Normal(exit 0)
55~60 肌寒い Normal(exit 0)
60~65 何も感じない Normal(exit 0)
65~70 快い Normal(exit 0)
70~75 暑くない Normal(exit 0)
75~80 やや暑い Warning(exit 1)
80~85 暑くて汗が出る Warning(exit 1)
85~ 暑くてたまらない Critical(exit 2)

プラグイン

以下のような OpenWeatherMap から取得出来るレスポンスをパースして標準出力に出力するだけのスクリプトを用意。

gist.github.com

スクリプトコマンドラインから以下のように実行することで動作確認をすることが出来る。

# チェック
$ ./open_weather_map.py fukuoka-shi check
fukuoka-shi temperature-humidity_index.current 78.1478 warning

# メトリクス
$ ./open_weather_map.py fukuoka-shi,tokyo metrics
stats.fukuoka-shi.temperature.current 29.88 1436683931

stats.fukuoka-shi.humidity.current 58 1436683931

stats.fukuoka-shi.temperature-humidity_index.current 78.1478 1436683931

stats.tokyo.temperature.current 31.76 1436683931

stats.tokyo.humidity.current 70 1436683931

stats.tokyo.temperature-humidity_index.current 82.883 1436683931

メトリクスは第一引数に都市名をカンマ区切りで並べることで複数の都市の温度と湿度を取得出来るようにした。

ということで、メトリクス収集用の Sensu Check の設定。

{
  "checks": {
    "metrics-weather": {
      "type": "metric",
      "handlers": ["graphite", "file"],
      "command": "open_weather_map.py fukuoka-shi,tokyo metrics",
      "interval": 300,
      "standalone": true
    }
  }
}

更に不快指数を判断してアラートを上げる為の Sensu Check 設定。

{
  "checks": {
    "check-temperature-humidity-index-fukuoka": {
      "handlers": ["file"],
      "command": "open_weather_map.py fukuoka-shi check",
      "interval": 300,
      "standalone": true
    }
  }
}

例えば、本日の状況

メトリクス

f:id:inokara:20150712154825p:plain

Grafana の Singlestat パネルにもしきい値を設定している。湿度は 60% 前後であるが気温が 30 度を超えており、不快指数は注意レベル。

チェック

f:id:inokara:20150712154838p:plain

Grafana 同様に不快指数は Warning となっている。


ということで...

参考

openweathermap.org

今回利用した API 以外にも有償の API もあるようだ。

qiita.com

API レスポンスの内容について参考にさせて頂きました。

最後に

OpenWeatherMap に感謝しつつ、気温、湿度、不快指数には注意してコマメな水分補給と休養で熱中症を予防しましょう。

Sensu 復習(1)〜 Grafana 2.0 導入メモ 〜

Sensu について復習してみたいと思う。


ということで...

復習環境に Grafana 2.0 を導入した際のメモ。


Grafana とは

サイト

  • 本家

grafana.org

github.com

スクショ

説明下手なのでスクショ一枚で。

f:id:inokara:20150708073331p:plain

三行で

  • Graphite 等の時系列データベースに蓄積されたメトリクスを綺麗に見せるダッシュボード
  • Sensu でメトリクス見るならほぼ標準
  • 導入はとても簡単(でした)

サポートする時系列データベース

上記以外にも KariosDBSQL も実験的にサポートされるようだ。 尚、 Elasticsearch もサポートされているが、実際に試してみたところ手元の環境で Elasticsearch のメトリクスを Grafana に表示することは出来なかった(多分、自分のやり方が悪い)ので引き続き試す。(※もしかしたら Elasticsearch をサポートしているのはダッシュボードを管理している部分だけなのかもしれない...)

2.0 にて追加された機能

docs.grafana.org

上記に纏まっているものをザクっと要約。

  • 独自のバックエンドデータベースが追加
  • バックエンドデータベースへの接続をプロキシするようになり CROS も気にする必要が無い
  • 三種類(閲覧、編集、管理者)の権限をユーザー又は組織に対して付与出来るようになった
  • ダッシュボード共有機能の強化(スナップショットの共有、共有の期限等)
  • パネル毎に時系列を設定出来るようになった
  • raintank との連携

上記以外でも Grafana 自体がパッケージ化されたことにより各ディストリビューション毎のパッケージ管理ツールで導入することが出来るようにもなっている。


ということで...導入

参考

docs.grafana.org

今回は VirtualBox 上の CentOS 6.4 にインストールする。

yum リポジトリの追加

/etc/yum.repos.d/grafana.repo を以下のように作成。

[grafana]
name=grafana
baseurl=https://packagecloud.io/grafana/stable/el/6/$basearch
repo_gpgcheck=1
enabled=1
gpgcheck=1
gpgkey=https://packagecloud.io/gpg.key https://grafanarel.s3.amazonaws.com/RPM-GPG-KEY-grafana
sslverify=1
sslcacert=/etc/pki/tls/certs/ca-bundle.crt

yum install

sudo yum install grafana

以上。

起動

sudo service grafana

以上。

尚、デフォルトではポート 3000 番で Listen するので、残念ながら Uchiwa と同居する場合にはどちらかのポートを変えなければいけないということに気づくはず...。Grafana のポート変更を行う場合には /etc/grafana/grafana.ini の設定にて変更を行う。(設定については別途)

早速、ブラウザでアクセスすると以下のようなログイン画面となる。

f:id:inokara:20150708082824p:plain

デフォルトの認証情報はユーザー名、パスワード共に admin となるので、ログインを確認したら変更しておく。

設定

Grafana 自体の設定は /etc/grafana/grafana.ini にて行う。

##################### Grafana Configuration Example #####################
#
# Everything has defaults so you only need to uncomment things you want to
# change

; app_mode = production

#################################### Paths ####################################
[paths]
# Path to where grafana can store temp files, sessions, and the sqlite3 db (if that is useD)
#
;data = /var/lib/grafana
#
# Directory where grafana can store logs
#
;logs = /var/log/grafana

#################################### Server ####################################
[server]
# Protocol (http or https)
;protocol = http

# The ip address to bind to, empty will bind to all interfaces
;http_addr =

# The http port  to use
http_port = 3001

# The public facing domain name used to access grafana from a browser
;domain = localhost

# The full public facing url
;root_url = %(protocol)s://%(domain)s:%(http_port)s/

# Log web requests
;router_logging = false

# the path relative working path
;static_root_path = public

# enable gzip
;enable_gzip = false

# https certs & key file
;cert_file =
;cert_key =

#################################### Database ####################################
[database]
# Either "mysql", "postgres" or "sqlite3", it's your choice
;type = sqlite3
;host = 127.0.0.1:3306
;name = grafana
;user = root
;password =

# For "postgres" only, either "disable", "require" or "verify-full"
;ssl_mode = disable

# For "sqlite3" only, path relative to data_path setting
;path = grafana.db

#################################### Session ####################################
[session]
# Either "memory", "file", "redis", "mysql", default is "memory"
;provider = file

# Provider config options
# memory: not have any config yet
# file: session dir path, is relative to grafana data_path
# redis: config like redis server addr, poolSize, password, e.g. `127.0.0.1:6379,100,grafana`
# mysql: go-sql-driver/mysql dsn config string, e.g. `user:password@tcp(127.0.0.1)/database_name`
;provider_config = sessions

# Session cookie name
;cookie_name = grafana_sess

# If you use session in https only, default is false
;cookie_secure = false

# Session life time, default is 86400
;session_life_time = 86400

#################################### Analytics ####################################
[analytics]
# Server reporting, sends usage counters to stats.grafana.org every 24 hours.
# No ip addresses are being tracked, only simple counters to track
# running instances, dashboard and error counts. It is very helpful to us.
# Change this option to false to disable reporting.
;reporting_enabled = true

# Google Analytics universal tracking code, only enabled if you specify an id here
;google_analytics_ua_id =

#################################### Security ####################################
[security]
# default admin user, created on startup
;admin_user = admin

# default admin password, can be changed before first start of grafana,  or in profile settings
;admin_password = admin

# used for signing
;secret_key = SW2YcwTIb9zpOOhoPsMm

# Auto-login remember days
;login_remember_days = 7
;cookie_username = grafana_user
;cookie_remember_name = grafana_remember

#################################### Users ####################################
[users]
# disable user signup / registration
;allow_sign_up = true

# Allow non admin users to create organizations
;allow_org_create = true

# Set to true to automatically assign new users to the default organization (id 1)
;auto_assign_org = true

# Default role new users will be automatically assigned (if disabled above is set to true)
;auto_assign_org_role = Viewer

#################################### Anonymous Auth ##########################
[auth.anonymous]
# enable anonymous access
;enabled = false

# specify organization name that should be used for unauthenticated users
;org_name = Main Org.

# specify role for unauthenticated users
;org_role = Viewer

#################################### Github Auth ##########################
[auth.github]
;enabled = false
;client_id = some_id
;client_secret = some_secret
;scopes = user:email
;auth_url = https://github.com/login/oauth/authorize
;token_url = https://github.com/login/oauth/access_token
;api_url = https://api.github.com/user
# Uncomment bellow to only allow specific email domains
; allowed_domains = mycompany.com othercompany.com

#################################### Google Auth ##########################
[auth.google]
;enabled = false
;client_id = some_client_id
;client_secret = some_client_secret
;scopes = https://www.googleapis.com/auth/userinfo.profile https://www.googleapis.com/auth/userinfo.email
;auth_url = https://accounts.google.com/o/oauth2/auth
;token_url = https://accounts.google.com/o/oauth2/token
;api_url = https://www.googleapis.com/oauth2/v1/userinfo
# Uncomment bellow to only allow specific email domains
; allowed_domains = mycompany.com othercompany.com

#################################### Logging ##########################
[log]
# Either "console", "file", default is "console"
# Use comma to separate multiple modes, e.g. "console, file"
;mode = console, file

# Buffer length of channel, keep it as it is if you don't know what it is.
;buffer_len = 10000

# Either "Trace", "Debug", "Info", "Warn", "Error", "Critical", default is "Trace"
;level = Info

# For "console" mode only
[log.console]
;level =

# For "file" mode only
[log.file]
;level =
# This enables automated log rotate(switch of following options), default is true
;log_rotate = true

# Max line number of single file, default is 1000000
;max_lines = 1000000

# Max size shift of single file, default is 28 means 1 << 28, 256MB
;max_lines_shift = 28

# Segment log daily, default is true
;daily_rotate = true

# Expired days of log file(delete after max days), default is 7
;max_days = 7

#################################### AMPQ Event Publisher ##########################
[event_publisher]
;enabled = false
;rabbitmq_url = amqp://localhost/
;exchange = grafana_events

上記の通り、全文掲載。

英語がダメダメな自分でもドキュメントから読み取れない機能や設定は設定ファイルを見ると判るのがせめてもの救いだが、先述のポート番号変更は http_port を修正する。また、GithubGoogle の認証への対応や AMQP を使ったイベントの配信等もサポートしているようだ(何に使うんだ...)。


ハンズオン

やること

せっかくなのでハンズオンしてみたい。

  • データソース(データベース)の登録
  • メトリクスの登録
  • ダッシュボードの共有機能を試す

尚、ハンズオンの環境は下記の通り、Sensu から Graphite に送られてくるメトリクスを利用してダッシュボードを作成して共有してみる。

f:id:inokara:20150708100143p:plain

データソース(データベース)の登録

詳細はドキュメントを。

f:id:inokara:20150708100945p:plain

  • Data Source メニューから Add new をクリックして登録する
  • Type から Graphite を選択
  • Url には http://localhost:80 を記載し AccessProxy を選択する

尚、Access には ProxyDirect があり、違いについては以下の通り。

  • Proxy は Grafana Backend を介したアクセス
  • Direct はブラウザから直接アクセス(2.0 以前の接続方法だったはず...)

メトリクスの登録(1)

Graph パネルにメトリクスを登録してみる。 詳細はドキュメントを。

f:id:inokara:20150708143632p:plain

ADD ROW をクリックして Row を追加、引き続き、Add Panel から Graph をクリックする。

f:id:inokara:20150708145028p:plain

Metrics タブをクリックして必要なメトリクスをプルダウンで選択していく。

メトリクスの登録(2)

Singlestat パネルにメトリクスを登録してみる。 詳細はドキュメントを。

f:id:inokara:20150708150636p:plain

上図のように時系列データではなく、ある時点の値や合計値、平均値等を表示することが出来る。

f:id:inokara:20150708150413p:plain

メトリクスの登録については Graph パネルと同様にデータソースを指定してメトリクスを選択し、Options タブにて平均値や合計値等を指定する。また、しきい値を設けることで値によって色を付ける事も出来る。

ダッシュボードの共有機能を試す

実際の運用でダッシュボードを共有することがあるか(ニーズがあるか)判らないが...Share Dashboard をクリックすると以下のようにダッシュボードのリンクが表示される。

f:id:inokara:20150708153443p:plain

これをこのまま共有するとメトリクスのクエリ情報等の外部に共有する必要の無い情報までも共有されてしまう。

f:id:inokara:20150708154842p:plain

これを解決する為に上記のようなスナップショット機能が提供されており、以下のような 2 つの機能が提供されている。尚、実際に試してみたところ、スナップショット機能はスナップショットを作成した時点よりも以前のメトリクスのみが確認出来るのでまさにスナップショット。

  • Publish snapshots(snapshot.raintank.io にパブリッシュする)
  • Local snapshot(ローカルの URL が与えられるが Link とは異なる)

今回は Publish snapshots を利用して snapshot.raintank.io に時間限定(1 時間)で公開してみた。

f:id:inokara:20150708155306p:plain

表示されている URL にアクセスしてみると...

f:id:inokara:20150708155329p:plain

おお。 しかも、日本語のタイトルでも問題無さそう。

f:id:inokara:20150708155401p:plain

そして、気になるクエリ等が共有されていないかを念のために確認してみるとクエリ等は共有されていない。


ということで...

Grafana 2.0 のインストールからホンのちょっとだけ触ってみたが、データソースの指定や共有機能、今回は触れなかったユーザー管理機能等多くの機能が追加されており、また、以前のバージョンだと閲覧している PC の CPU 負荷が高くなってしまう状況も見られなかったので、従来バージョンを利用している場合にはバージョンアップを検討しても良いかもしれない。

尚、1.x 系から 2.0 へのバージョンアップについては以下のページにて言及されている。

docs.grafana.org

ポイントとしては...

  • config.js は廃止
  • データソースは Grafana のダッシュボード、HTTP API で再設定する必要がある
  • ダッシュボードは Elasticsearch のインデックスを直接参照する方法で移行する

となっている。


次回は...

github.com

から...

github.com

に変更になったことによる、導入の方法等について復習してみたい。

Elasticsearch の JVM のヒープ使用量を Graphite / Grafana で可視化するちょっとしたスクリプト

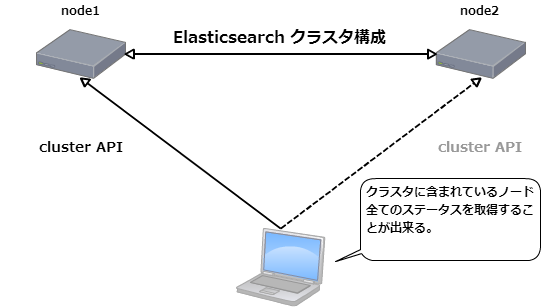
Elasticsearch の JVM ヒープ使用量を Graphite と Grafana を利用して可視化したいと思ったので Cluster APIPython を利用して実現してみた。

Cluster API

Cluster APIsNodes Stats を利用するので curl を利用して取得してみる。

f:id:inokara:20150703081941p:plain

実際に叩いてみる。

$ curl -XGET 'http://localhost:9200/_nodes/stats/jvm?pretty=true'
{
  "cluster_name" : "kappa-elasticsearch",
  "nodes" : {
    "RiQNuftXTIO2fiX4GJjO4w" : {
      "timestamp" : 1435845867712,
      "name" : "node2",
      "transport_address" : "inet[/xxx.xxx.xx.11:9300]",
      "host" : "localhost.localdomain",
      "ip" : [ "inet[/xxx.xxx.xx.11:9300]", "NONE" ],
      "jvm" : {
        "timestamp" : 1435845867712,
        "uptime_in_millis" : 44858656,
        "mem" : {
          "heap_used_in_bytes" : 105512584,
          "heap_used_percent" : 9,
          "heap_committed_in_bytes" : 259719168,
          "heap_max_in_bytes" : 1065025536,
          "non_heap_used_in_bytes" : 49661032,
          "non_heap_committed_in_bytes" : 49938432,
          "pools" : {
            "young" : {
              "used_in_bytes" : 64778368,
              "max_in_bytes" : 69795840,
              "peak_used_in_bytes" : 69795840,
              "peak_max_in_bytes" : 69795840
            },
            "survivor" : {
              "used_in_bytes" : 2255592,
              "max_in_bytes" : 8716288,
              "peak_used_in_bytes" : 8716288,
              "peak_max_in_bytes" : 8716288
            },
            "old" : {
              "used_in_bytes" : 38478624,
              "max_in_bytes" : 986513408,
              "peak_used_in_bytes" : 38478624,
              "peak_max_in_bytes" : 986513408
            }
          }
        },
        "threads" : {
          "count" : 37,
          "peak_count" : 42
        },
        "gc" : {
          "collectors" : {
            "young" : {
              "collection_count" : 41,
              "collection_time_in_millis" : 369
            },
            "old" : {
              "collection_count" : 0,
              "collection_time_in_millis" : 0
            }
          }
        },
        "buffer_pools" : {
          "direct" : {
            "count" : 198,
            "used_in_bytes" : 6273408,
            "total_capacity_in_bytes" : 6273408
          },
          "mapped" : {
            "count" : 10,
            "used_in_bytes" : 205985,
            "total_capacity_in_bytes" : 205985
          }
        }
      }
    },
    "BPARRUhjSMuQlJBBxrp4Mg" : {
      "timestamp" : 1435845867715,
      "name" : "node1",
      "transport_address" : "inet[/xxx.xxx.xx.10:9300]",
      "host" : "localhost.localdomain",
      "ip" : [ "inet[/xxx.xxx.xx.10:9300]", "NONE" ],
      "jvm" : {
        "timestamp" : 1435845867715,
        "uptime_in_millis" : 44867169,
        "mem" : {
          "heap_used_in_bytes" : 79838632,
          "heap_used_percent" : 7,
          "heap_committed_in_bytes" : 259719168,
          "heap_max_in_bytes" : 1065025536,
          "non_heap_used_in_bytes" : 48005728,
          "non_heap_committed_in_bytes" : 48300032,
          "pools" : {
            "young" : {
              "used_in_bytes" : 40145808,
              "max_in_bytes" : 69795840,
              "peak_used_in_bytes" : 69795840,
              "peak_max_in_bytes" : 69795840
            },
            "survivor" : {
              "used_in_bytes" : 2416792,
              "max_in_bytes" : 8716288,
              "peak_used_in_bytes" : 8716288,
              "peak_max_in_bytes" : 8716288
            },
            "old" : {
              "used_in_bytes" : 37276032,
              "max_in_bytes" : 986513408,
              "peak_used_in_bytes" : 37276032,
              "peak_max_in_bytes" : 986513408
            }
          }
        },
        "threads" : {
          "count" : 39,
          "peak_count" : 44
        },
        "gc" : {
          "collectors" : {
            "young" : {
              "collection_count" : 40,
              "collection_time_in_millis" : 355
            },
            "old" : {
              "collection_count" : 0,
              "collection_time_in_millis" : 0
            }
          }
        },
        "buffer_pools" : {
          "direct" : {
            "count" : 68,
            "used_in_bytes" : 4085453,
            "total_capacity_in_bytes" : 4085453
          },
          "mapped" : {
            "count" : 10,
            "used_in_bytes" : 206859,
            "total_capacity_in_bytes" : 206859
          }
        }
      }
    }
  }
}

上記のように Elasticsaerch のクラスタを構成している全てのノード JVM に関する各種値を取得することが出来るので、これらの値から jvm キーに含まれる mem キーの heap_used_in_bytes を取得するスクリプトを作成してみたい。スクリプトの言語は基本的に問わないが、CentOS ですぐに利用出来る Python を利用して作成する。


スクリプトと Sensu からの利用

スクリプト

以下のようなスクリプトを作ってみた。

#!/usr/bin/env python

import json, urllib2, sys, time, random

argvs     = sys.argv
hosts = argvs[1].split(",")

url = 'http://' + random.choice(hosts) + ':9200/_nodes/stats/jvm'
r = urllib2.urlopen(url)
j = json.loads(r.read())
nodes = j['nodes']
for node in nodes:
        timestamp = int(time.time())
        label = argvs[2] + '.' + j['nodes'][node]['name'] + '.' + 'elasticsearch_jvm.heap_used'
        print '%s %s %d\n' % (label, j['nodes'][node]['jvm']['mem']['heap_used_in_bytes'], timestamp)
r.close()

PythonHello World レベルの為、謎や無駄が多くなってしまっているかもしれない... で、実際に利用する場合には、以下のように利用する。

$ ./script.py node1,node2 foo

第一引数にはクラスタに含まれるノードをカンマ区切りで渡す。また、第二引数には Graphite で利用するトップレベルネームを指定する。 実行結果は以下のようになる。

foo.node2.elasticsearch_jvm.heap_used 84739064 1435879508

foo.node1.elasticsearch_jvm.heap_used 51600232 1435879508

Sensu からの利用

既に Sensu プラグインでは sensu-plugins-elasticsearch というプラグインが配布されており、実際に metrics-es-node-graphite.rb を利用してみるとプラグインを動かしているホストの CPU 使用率が高くなってしまう現象が見られた(自分の環境だけかもしれないが)ので、今回はシンプルにヒープサイズのみを取得するようにしてみた。

以下のような利用シーンをイメージ。

f:id:inokara:20150703084012p:plain

スクリプト/etc/sensu/plugins 以下に実行権限を付けて設置する。

sudo mv script.py /etc/sensu/plugins/

Sensu Check の設定は以下のように。今回は Standalone Check を有効にしている。

{
  "checks": {
    "metrics-elasticsearch-jvm-heap": {
      "type": "metric",
      "handlers": ["graphite", "file"],
      "command": "script.py node1,node2 foo",
      "interval": 30,
      "standalone": true
    }
  }
}

設定すると以下のように Grafana で確認することが出来るようになる。

f:id:inokara:20150703085508p:plain

おお、Grafana キレイ。

おまけ

Cluster API のエンドポイントをランダムに選択する実装

上記例の node1 と node2 のどちらのノードでも Cluster API が同様に結果を返してくれるのであれば、スクリプトでもどちらかのノードにアクセスさせることで、負荷の偏りを防ぐ、片方のノードが落ちてもメトリクスの収集が出来る(その前に復旧すれば良いが...)というメリットがありそうなので、アクセスするエンドポイントをランダムに選択するようにしてみたのが以下。

(略)
hosts = argvs[1].split(",")

url = 'http://' + random.choice(hosts) + ':9200/_nodes/stats/jvm'

スクリプトの第一引数で対象のノードをカンマ区切りで指定するところと random.choice を利用しているところがミソ。カンマ区切りの第一引数は配列になって変数 hosts に代入されて、random.choice により配列からランダムに一つのノードが取り出されてエンドポイントにアクセスする。

$ ./script.py node1,node2 foo
http://node1:9200/_nodes/stats/jvm
foo.node2.elasticsearch_jvm.heap_used 65309008 1435882093

foo.node1.elasticsearch_jvm.heap_used 106770624 1435882093

$ ./script.py node1,node2 foo
http://node2:9200/_nodes/stats/jvm
foo.node2.elasticsearch_jvm.heap_used 65323128 1435882095

foo.node1.elasticsearch_jvm.heap_used 106774232 1435882095

$ ./script.py node1,node2 foo
http://node2:9200/_nodes/stats/jvm
foo.node2.elasticsearch_jvm.heap_used 65328928 1435882099

foo.node1.elasticsearch_jvm.heap_used 106774232 1435882099

$ ./script.py node1,node2 foo
http://node1:9200/_nodes/stats/jvm
foo.node2.elasticsearch_jvm.heap_used 66125096 1435882100

foo.node1.elasticsearch_jvm.heap_used 107118056 1435882100

実際にアクセスさせてみると、上記のように node1 と node2 がランダムに利用されていることが判る。

EC2 の meta-data を利用してインスタンス ID を取得する場合

以下のように urllib2 を利用して簡単に取得することが出来る。

meta_url = 'http://169.254.169.254/latest/meta-data/instance-id'
i = urllib2.urlopen(meta_url)
instance_id = i.read()
i.close()

ということで

も少しちゃんとスクリプトを作れるようになりたいのと、ヒープ使用量以外の値も同時に取得出来るように少し修正しなければ。

JMeter の Backend Listener に InfluxDB を使ってレスポンスタイムを Grafana で可視化する

はじめに

JMeter のテスト結果を Grafana とかで見れたら幸せになれそうだなーって思っていたら Backend Listener を使えばレスポンスタイムを InfluxDB と Grafana で可視化出来るよーって @muramasa64 さんに教えて貰ったので早速試してみた。

f:id:inokara:20150404110814p:plain

このグラフでも悪くはないんだけど...。

参考

手順

準備

  • JMeter 2.13 をダウンロードしてインストール(今回は MacOS X にて試す)
  • 負荷を掛ける対象のアプリケーション(PlayFramework)が動いている Docker コンテナを用意
  • InfluxDB と Grafana が動く Docker コンテナを用意

Docker コンテナの構成

% docker ps
CONTAINER ID        IMAGE                      COMMAND             CREATED             STATUS              PORTS                                                                                              NAMES
791f50fd1bd9        inokappa/influxdb:latest   "/bin/bash"         About an hour ago   Up About an hour    0.0.0.0:49161->2003/tcp, 0.0.0.0:49162->80/tcp, 0.0.0.0:49163->8083/tcp, 0.0.0.0:49164->8086/tcp   influxdb00
bbce0b40aa88        play-debug:latest          "/bin/bash"         24 hours ago        Up About an hour    0.0.0.0:49153->7000/tcp, 0.0.0.0:49154->9000/tcp                                                   play-debug01

JMeter

スレッドグループのサンプラーで HTTP リクエストを定義。

f:id:inokara:20150404085610p:plain

アクセス先のホスト、ポート、パスを指定する。

Backend Lister を有効にする。

f:id:inokara:20150404085807p:plain

Grafana のホスト、ポートを指定する。

Influxdb

Graphite Input Plugin を有効にして Influxdb を起動しておく。

# diff -u config.toml.bk config.toml
--- config.toml.bk      2015-04-03 22:26:33.000000000 +0000
+++ config.toml 2015-04-03 22:27:05.000000000 +0000
@@ -39,10 +39,10 @@

   # Configure the graphite api
   [input_plugins.graphite]
-  enabled = false
-  # address = "0.0.0.0" # If not set, is actually set to bind-address.
-  # port = 2003
-  # database = ""  # store graphite data in this database
+  enabled = true
+  address = "0.0.0.0" # If not set, is actually set to bind-address.
+  port = 2003
+  database = "jmeter"  # store graphite data in this database
   # udp_enabled = true # enable udp interface on the same port as the tcp interface

   # Configure the collectd api

InfluxDB が起動したら jmeter という名前でデータベースを作成する。

Grafana

今回は grafana-1.9.1 を利用。

# diff -u config.sample.js config.js
--- config.sample.js    2014-12-29 10:25:17.000000000 +0000
+++ config.js   2015-04-03 23:01:35.044415428 +0000
@@ -17,23 +17,21 @@
       */

       // InfluxDB example setup (the InfluxDB databases specified need to exist)
-      /*
       datasources: {
         influxdb: {
           type: 'influxdb',
-          url: "http://my_influxdb_server:8086/db/database_name",
-          username: 'admin',
-          password: 'admin',
+          url: "http://192.168.59.103:49164/db/jmeter",
+          username: 'your_name',
+          password: 'your_pass',
         },
         grafana: {
           type: 'influxdb',
-          url: "http://my_influxdb_server:8086/db/grafana",
-          username: 'admin',
-          password: 'admin',
+          url: "http://192.168.59.103:49164/db/jmeter",
+          username: 'your_name',
+          password: 'your_pass',
           grafanaDB: true
         },
       },
-      */

       // Graphite & Elasticsearch example setup
       /*

実施

テスト開始

f:id:inokara:20150404090353p:plain

結果

f:id:inokara:20150404090658p:plain

おお。

各メトリクスについては...

上記を転載。

以下、スレッドメトリクス。

Metric Name Description
[rootMetricsPrefix].test.minAT Min active threads
[rootMetricsPrefix].test.maxAT Max active threads
[rootMetricsPrefix].test.meanAT Mean active threads
[rootMetricsPrefix].test.startedT Started threads
[rootMetricsPrefix].test.endedT Finished threads

以下、アクセスに成功したリクエストのレスポンスタイムメトリクス。

Metric Name Description
[rootMetricsPrefix].[samplerName].ok.count Number of successful responses for sampler name
[rootMetricsPrefix].[samplerName].ok.min Min response time for successful responses of sampler name
[rootMetricsPrefix].[samplerName].ok.max Max response time for successful responses of sampler name
[rootMetricsPrefix].[samplerName].ok.pct[percentileValue] Percentile computed for successful responses of sampler name. You can input as many percentiles as you want (3 or 4 being a reasonable value). When percentile contains a comma for example "99.9", dot is sanitized by "_" leading to 99_9. By default listener computes percentiles 90%, 95% and 99%

以下、アクセスに失敗したリクエストのレスポンスタイムメトリクス。

Metric Name Description
[rootMetricsPrefix].[samplerName].ko.count Number of failed responses for sampler name
[rootMetricsPrefix].[samplerName].ko.min Min response time for failed responses of sampler name
[rootMetricsPrefix].[samplerName].ko.max Max response time for failed responses of sampler name
[rootMetricsPrefix].[samplerName].ko.pct[percentileValue] Percentile computed for failed responses of sampler name. You can input as many percentiles as you want (3 or 4 being a reasonable value).When percentile contains a comma for example "99.9", dot is sanitized by "_" leading to 99_9. By default listener computes percentiles 90%, 95% and 99%

以下、リクエスト全体のレスポンスタイムメトリクス。

Metric Name Description
[rootMetricsPrefix].[samplerName].a.count Number of responses for sampler name
[rootMetricsPrefix].[samplerName].a.min Min response time for responses of sampler name
[rootMetricsPrefix].[samplerName].a.max Max response time for responses of sampler name
[rootMetricsPrefix].[samplerName].a.pct[percentileValue] Percentile computed for responses of sampler name. You can input as many percentiles as you want (3 or 4 being a reasonable value).When percentile contains a comma for example "99.9", dot is sanitized by "_" leading to 99_9. By default listener computes percentiles 90%, 95% and 99%

なるほど。

f:id:inokara:20150404141317p:plain

上記のようになる。

ということで

JMeter がとても身近に感じられました。

InfluxDB を Ruby から操作するチュートリアル

1500 万人の時系列データベースファンの皆様、おはようございます。かっぱです。

はじめに

  • InfluxDBRuby 経由で使いたくなったのでメモ
  • Grafana と連携が簡単なので合わせてメモ

InfluxDB のうんちく

うんちくよりも以下の参考サイト。

ざっくり言うと...

  • time series database(時系列データベース)の一つ
  • イベントデータ等の時系列なデータを蓄積するのに特化している
  • バックエンドでは leveldb というエンジンが動いている
  • 実装は go
  • HTTP でデータの登録や検索可能
  • スキーマレス
  • SQL ライクなクエリ
  • Web UI が同梱されている
  • RDBMS で言うところのデータベースのことは同じくデータベースと呼ぶ
  • テーブルのことは series と呼ぶようだ
  • 絶賛開発中(というイメージ)

個人的な印象としては...

  • セットアップ簡単(簡単に Dcokerfile に落とし込めた)
  • 軽量
  • SQL ライクなところは良い
  • Web API が不親切(だと思った)→レスポンスはヘッダを見ろとのことで...

InfluxDB の構築

docker build からの docker run

Dcokerfile を作ったのでそやつを利用する。

git clonehttps://github.com/inokappa/dockerfiles.git
cd dockerfiles/InfluxDB
docker build -t your_name/your_repo .

build が終わったら run する。

docker run -t -d your_name/your_repo

run したらブラウザでアクセスしてみる。

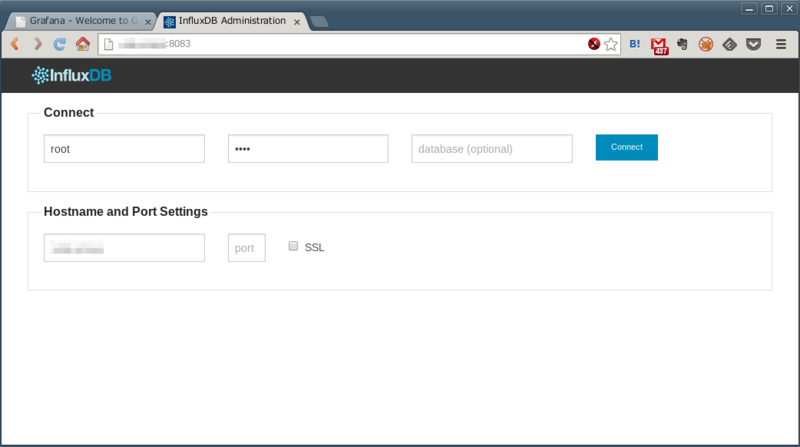
f:id:inokara:20140601093726p:plain

おお、とっても簡単。


Ruby から InfluxDB を操作する

influxdb/influxdb-ruby の一択

今のところ influxdb/influxdb-ruby が一択。

インストールは...

sudo gem install influxdb-ruby --no-ri --no-rdoc -V

簡単ですな。

サンプル(1)データベース作成

tutorial というデータベースを 'xxx.xxx.xxx.xxx' 上の InfluxDB に作成する。

#!/usr/bin/env ruby

require 'influxdb'

database = 'tutorial'

influxdb = InfluxDB::Client.new host: 'xxx.xxx.xxx.xxx'
influxdb.create_database(database)

簡単ですな。

サンプル(2)データベースにデータを登録

tutorial というデータベースに test1 から test5 のシリーズにランダムな数字を順次書き込む。

#!/usr/bin/env ruby

require 'influxdb'

host     = 'xxx.xxx.xxx.xxx'
username = 'xxxx'
password = 'xxxx'
database = 'tutorial'
time_precision = 's'

influxdb = InfluxDB::Client.new database, :username => username,
                                          :password => password,
                                          :host => host,
                                          :time_precision => time_precision

NAMES = ['test1', 'test2', 'test3', 'test4', 'test5']
NAMES.each do |name|
  data = {
    :value => rand(10000) + 1,
    :time => Time.now.to_i
  }
  influxdb.write_point(name, data)
end

Grafana との連携

config.js

Grafanaconfig.js に以下を設定する。

     datasources: {
      influx: {
        default: true,
        type: 'influxdb',
        url: "http://xxx.xxx.xxx.xxx:8086/db/tutorial",
        username: 'root',
        password: 'root',
       }
     },

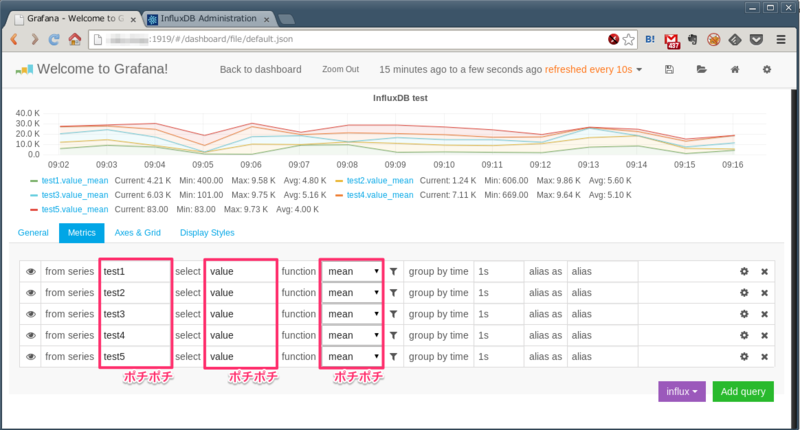
ポチポチと...

サンプル(2)を cron で叩かせた状態でメトリクスを Grafana で見てみる。

f:id:inokara:20140601093740p:plain

config.js の設定が適切であればデータベースやシリーズの情報が Grafana に自動で読み込まれているのでポチポチとメトリクスの設定を行っていく。

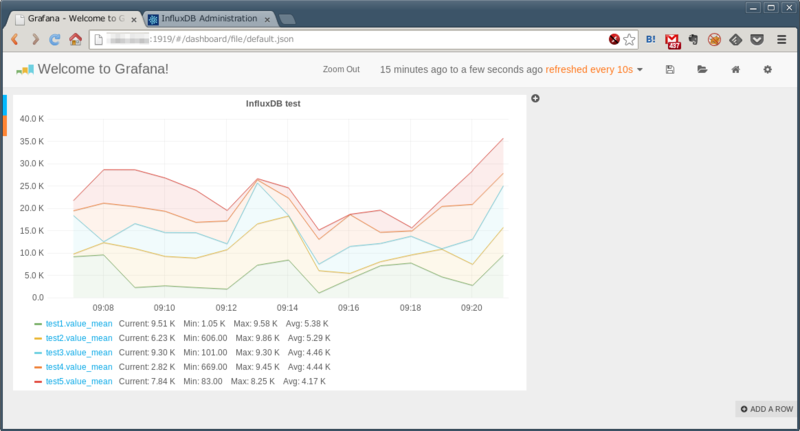
こんな感じで...

f:id:inokara:20140601093752p:plain

出来ました。


引き続き

Grafana のScripted Dashboard を試す + Graphite の Render API もちょっと試す

どうも JavaScript は全くの素人のかっぱです。すいません。

はじめに

前回、前々回と Grafana を弄ってきて Scripted Dashboard が気になっていたので触ってみた。前回の記事で利用した td-agentmonitor_agent から取得してきたメトリクスを利用して Scripted Dashboard を試してみる。


わっといず Scripted Dashboard

ペラ一枚という言い方は失礼かもしれないがドキュメントは上記のページのみ。逆に言うと JavaScript の知識があれば自由に使えるよーってことなのかも知れない。


こんな感じで...

写経に始まり、写経に終わる

Grafana を展開したディレクトリの app/dashboards 以下に scripted.js という JavaScript のファイルがあるのでそれを見よう見まねで作ってみた。

ネタ元は Export dashboard

上記の scripted.js はあくまでもサンプルなので細かい設定が出来なかったが、既に設定済みのダッシュボードから Export dashboard した際にダウンロードされる JSON ファイルから設定を拾うことが出来る。

f:id:inokara:20140531100204p:plain

以下(一部、抜粋)のような JSON が出力される。

上記の中から nullPointMode: "connected"steppedLine: true を拾い上げて追加してみた。

アクセスしてみる

以下のように引数を与えて scripted.js にアクセスしてみる。

http://grafana_url/#/dashboard/script/scripted.js?from=1h&rows=1&host=xx-xxx-xxx-xx&type=s3

f:id:inokara:20140531095027p:plain

おお、イケた。

でも...

ちょっと凝ったこと(複数ホストのメトリクスを表示させたいとか...)をしようとすると JavaScript という壁が立ちはだかる...のはどうしようか悩みどころ。


ということで

  • 以上、小ネタでした

おまけ

Graphite の Render API

GraphiteRender API という機能があるのでちょっと触ってみた。以下のような URL にアクセスすると...

http://graphite_url/render?target=averageSeries(*.file.buffer*)&from=-1hours&lineMode=connected&format=png&height=400&width=500

f:id:inokara:20140531103906p:plain

おお。後でも少し詳しく見てみよ。

td-agent(fluentd) の monitor_agent で取得出来る情報を Graphite + Grafana で見る試み

どうも、かっぱです。

追記

Grafana を手動でポチポチがかったるそうだったので Scripted-dashboard試してみた。

はじめに

以前に td-agentmonitor_agent を利用してこんなことをやっていたことを記事をツイートして頂いたようでして...

汗...

決して競合とかになろうとか思ったわけではない(笑)のだけども、ツイート頂いたことに感謝しつつ、あまりの不出来さに恥ずかしくなりながらも、次期バージョンwwに向けて Rubytd-agent の勉強のつもりで取得出来る情報を Graphite と Grafana で可視化してみた。

尚、ちゃんとモニタリングしたい場合にはTreasure Agent Monitoring Serviceを使うと良いと思います!


monitor_agent についておさらい

monitor_agent は何をするのか?

上記を参考にすると...

  • HTTP 経由で JSON 形式の内部メトリックを取得できる監視エージェント
  • 24220 ポートで Listen する
  • LTSV 形式でも情報を取得することが出来る

どんな情報が取得出来るのか?

  • 各ホストで稼働している td-agent or fluentdプラグイン情報
  • output プラグインretry_count / buffer_total_queued_size / buffer_queue_length
  • 下記の td_monitor_agentemit_count も合わせて取得出来る

設定

以下を td-agent.conf に追加して td-agent を再起動するだけ。

<source>
  type monitor_agent
  bind 0.0.0.0
  port 24220
</source>

取得出来る情報

以下のように HTTP リクエストを投げると...

curl -s http://${TD_AGENT_HOST}:24220/api/plugins.json | jq .

/api/plugin.json でアクセスすると以下のように JSON でレスポンスが返ってくる。

{
  "plugins": [
    {
      "config": {
        "port": "24220",
        "bind": "0.0.0.0",
        "type": "monitor_agent"
      },
      "output_plugin": false,
      "type": "monitor_agent",
      "plugin_id": "object:3f9bf86637c0"
    },
    {
      "config": {
        "tag": "apache.access",
        "path": "/var/log/httpd/access_log",
        "format": "apache",
        "type": "tail"
      },
      "output_plugin": false,
      "type": "tail",
      "plugin_id": "object:3f9bf72eedd4"
    },

/api/plugin でアクセスすると以下のように LTSV でレスポンスが返ってくる。

plugin_id:object:3f9bf86637c0   type:monitor_agent      output_plugin:false
plugin_id:object:3f9bf72eedd4   type:tail       output_plugin:false
plugin_id:object:3f9bf72f09b8   type:copy       output_plugin:true
plugin_id:object:3f9bf72f0508   type:stdout     output_plugin:true
plugin_id:object:3f9bf72f0080   type:file       output_plugin:true      buffer_queue_length:0   buffer_total_queued_size:2384070        retry_count:0
plugin_id:object:3f9bf731bcf8   type:file       output_plugin:true      buffer_queue_length:0   buffer_total_queued_size:2384070        retry_count:0
plugin_id:object:3f9bf731ae48   type:s3 output_plugin:true      buffer_queue_length:0   buffer_total_queued_size:13183110       retry_count:0

Tresure Data が提供するモニタリングサービスについて

現時点ではベータ版となっているようだが Tresure Data がモニタリングサービスを提供している。

f:id:inokara:20140531064529p:plain

以下のようにホストのリソース情報も確認することが出来る。

f:id:inokara:20140531072133p:plain

設定は monitor_agent と同様 td-agent.conf に以下を追加してプロセスを再起動するだけで監視が開始される。(※apikey は事前にダッシュボードで取得しておく必要がある)

<source>
  type td_monitor_agent
  apikey xxxxxxxxxxxxxxxxxxxxxxxxxxxxxxxxxxxxxxxxxxx
  instance_id xxxxxxx
  disable_node_info true
</source>

disable_node_infotrue にしておくとホストのリソース情報以外の情報を送信する(デフォルトは false になっている)。また、instance_id を指定しない場合には td-agent.conf のパスが表示されるようなので必要に応じて instance_id は設定しておいた方がたくさんのホストを管理する場合には良いかと思われる。

詳細については...

を見る。


で、どうするの?

こんな感じで...

各処理をどの位の粒度でメソッド化すれば良いのかも解らず、変数のスコープについてもシェルスクリプト的な使い方になってしまっているので突っ込みどころ満載。

大きな壁

monitor_agentJSONLTSV で返ってくることは解ったが、そのレスポンスからプラグイン毎で retry_count / buffer_total_queued_size / buffer_queue_length を取得する(JSON をパースする)のが(自分にとって)至難の技であることは間違い無かったが試行錯誤の上で以下のようにした。

返ってきた JSONplugin に含まれる数(size メソッド)をプラグインの数として、そのプラグイン数分(実際には配列は 0 から始まるので取得したプラグイン数からマイナス 1 をする)のループ処理で JSON からプラグイン毎の必要な値を取得した。

Graphite へのメトリクスを投げる

これは意外に簡単だった。幾つか Gem が存在する中で以下の Gem を利用した。

require 'graphite-api' しておいて以下のようなメソッドで処理するようにした。

def post_graphite(host, type, rtc, bql, btqs)
  client = GraphiteAPI.new( graphite: $graphite_host )
  client.metrics(
    "#{host}.#{type}.retry_count"  => rtc,
    "#{host}.#{type}.buffer_queue_length"  => bql,
    "#{host}.#{type}.buffer_total_queued_size"  => btqs
  )
end

Graphite. ピリオドをメトリクスパスの区切りとして利用する為 host という変数は .- に変換する処理を行っている。

実際に Graphite には以下のように登録される。

f:id:inokara:20140531075832p:plain

Grafana だと...

以下のような感じになる。

f:id:inokara:20140531075900p:plain

ホストが増えてくると手動でポチポチするのが耐えられなくなると思われる...(そこで GrafanaScripted-dashboardsの出番だったりするのかな...)


最後に

  • JSON をパースして結果をどうこうするという勉強にはなったが、もっと効率とか見栄え、メンテナンスし易い書き方を模索したい

ちょっとだけ解った気になる Graphite と Grafana

東京からおはようございます。かっぱです。

はじめに

  • Graphite は苦手だったのでちょっと克服したくて書いた

ほげふが

に書いた。